Utility concept and customer demand and market elasticity demand (economics unit 2 by Rohit Joshi )
Theory of demand -


 customers equilibrium -


 To calculate the Price Elasticity of Demand , we divide the change in quantity by initial quantity to calculate a percentage. If there is a Price rise from 50 to 70, we divide 20/50 = 0.4 = 40%.
What is demand ?
Demand is defined as the quantity of a commodity that a Consumer is capable of buying and is willing to pay the given price for it at the given time. The Theory of Demand is a Law that states the relationship between the quantity Demanded of a product and its price, assuming that all the other factors affecting the Demand are constant. According to the Law of Demand Theory, the quantity Demanded of a commodity is inversely related to its price in the market. Through this article, we will try to comprehend the Theory of derived Demand, the factors affecting Demand, the Demand curve and the application of Demand Theory .
Utility
Utility is a concept in economics that refers to the satisfaction, happiness, or benefit that individuals or consumers derive from consuming a good or service. It is a measure of the usefulness or enjoyment that people obtain from their choices and decisions. In economics, utility is often used to explain consumer behavior and preferences, with the assumption that people seek to maximize their overall utility when making decisions about what to buy or consume. Utility can be subjective and can vary from person to person, making it a fundamental concept in understanding how people make choices in a market economy.
Note - The unit of utility is util or utils .
Cardinal and ordinal utility -
Cardinal utility is an early concept in economics that suggests that the utility or satisfaction people derive from consuming goods and services can be measured and assigned numerical values. In other words, it assumes that individuals can quantify and compare the level of satisfaction or happiness they get from different choices.
However, this concept has largely been replaced by ordinal utility. Ordinal utility acknowledges that while we can rank preferences and choices (saying we prefer option A to option B), assigning specific numerical values to utility is not necessary for analyzing economic behavior. Most modern economic theories and models, like those based on the theory of revealed preference, work with ordinal utility, which focuses on preference rankings rather than precise utility measurements. This approach is considered more robust and avoids some of the challenges and assumptions associated with cardinal utility.
Example -
One example of cardinal utility might be using a numerical scale to measure and compare satisfaction or happiness. For instance, you could have a scale from 1 to 10, where 1 represents very low satisfaction or happiness, and 10 represents very high satisfaction or happiness. Using this scale, you might ask people to rate their level of satisfaction after consuming different goods or services. For instance:
1. After eating a piece of chocolate, you rate your satisfaction as 8 out of 10.
2. After watching a movie, you rate your satisfaction as 6 out of 10.
3. After going for a nice dinner, you rate your satisfaction as 9 out of 10.
In this case, you are assigning cardinal values to the level of satisfaction you experienced. However, it's important to note that modern economic theory tends to use ordinal utility, as it's based on the idea of preference rankings without assigning specific numerical values to utility.
Ordinal utility -
Ordinal utility is a concept in economics that recognizes that people can rank their preferences and choices without necessarily assigning specific numerical values to the level of satisfaction or utility they derive from those choices. In other words, it focuses on the order of preferences rather than the exact measurement of utility.
For example, with ordinal utility, you can say that you prefer option A over option B without quantifying how much more you prefer it. It acknowledges that individuals can make choices and express their preferences by saying one choice is better, worse, or equally preferred to another, but it doesn't require assigning precise numerical values to these preferences.
Ordinal utility is often used in modern economic models, as it simplifies the analysis of consumer behavior and avoids the complexities and assumptions associated with cardinal utility, which attempts to measure utility on a numerical scale.
Example - Certainly! Here's an example of ordinal utility:
Imagine you're at an ice cream shop, and you have three flavors to choose from: chocolate, vanilla, and strawberry.
1. You prefer chocolate over vanilla.
2. You prefer vanilla over strawberry.
3. You prefer strawberry over chocolate.
In this example, you've ranked your preferences without assigning specific numerical values to them. You've simply indicated the order in which you like these ice cream flavors. This demonstrates the concept of ordinal utility, where preferences are expressed based on the relative ranking of choices rather than assigning precise numerical measurements of satisfaction or utility.
Difference between Cardinal and ordinal utility -
Indifference curve analysis -
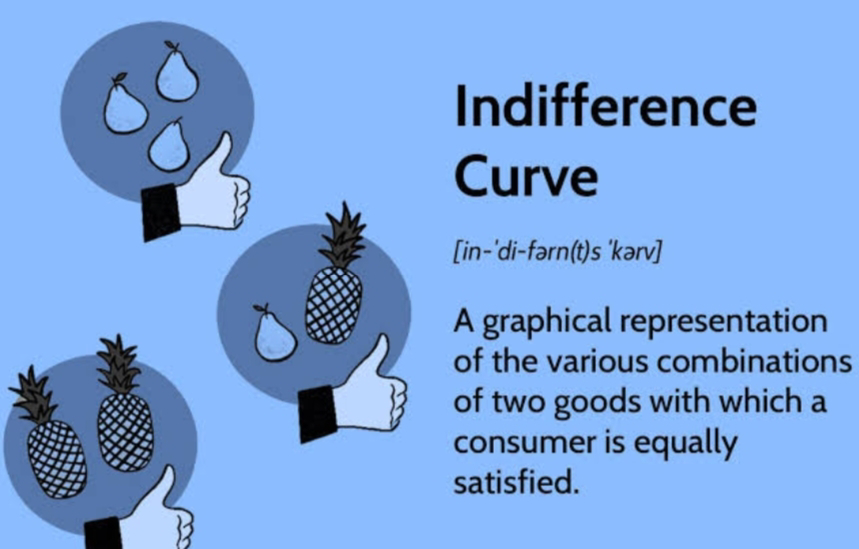
Indifference curve analysis is a fundamental concept in microeconomics used to analyze consumer preferences and decision-making. It's based on the idea that consumers make choices to maximize their utility, subject to their budget constraints. Here's an overview of how it works:
1. **Indifference Curves:** - An indifference curve is a graphical representation of different combinations of two goods (usually on a 2D graph) that provide the consumer with the same level of satisfaction or utility. Each point on the curve represents a combination of goods that the consumer is indifferent between, meaning they are equally happy with any of those combinations.
2. **Marginal Rate of Substitution (MRS):** - The slope of an indifference curve at any given point represents the marginal rate of substitution. It shows how much of one good a consumer is willing to give up to obtain one more unit of the other good while remaining at the same level of satisfaction.
3. **Budget Constraints:** To make real-world decisions, consumers must consider their budget constraints, which reflect the prices of goods and the income available to them. The budget constraint is typically represented as a straight line on the same graph.
4. **Optimal Choice:** Consumers aim to find the point of tangency between the highest possible indifference curve (representing maximum satisfaction) and their budget constraint line. This point represents the optimal choice of goods, considering their preferences and budget.
5. **Consumer Behavior:** By analyzing different indifference curves and budget constraints, economists can understand how consumers make choices, how changes in prices or income affect their decisions, and how they allocate their resources to maximize utility.
Indifference curve analysis is a powerful tool for understanding consumer behavior, and it provides insights into topics like demand elasticity, consumer surplus, and how changes in market conditions impact what consumers choose to buy.
Customer equilibrium is a key concept in economics that describes the optimal point at which a consumer allocates their income to maximize their satisfaction or utility, given their budget and the prices of goods. It's a central idea in microeconomics.
Here are the main components of consumer equilibrium:
1. **Budget Constraint:** Consumers have limited income to spend on various goods and services. This constraint is represented by their budget line, which is determined by the prices of goods and their income.
2. **Indifference Curves:** Consumers have preferences for different combinations of goods, which are represented by indifference curves. Each curve represents the same level of satisfaction. Consumers aim to reach the highest possible indifference curve, as it represents greater utility.
3. **Optimal Choice:** Consumer equilibrium occurs when the consumer selects a combination of goods (on their budget line) that is tangent to the highest possible indifference curve. This point of tangency represents the optimal choice where the consumer is allocating their income in a way that maximizes their satisfaction or utility.
In essence, consumer equilibrium is the point where a consumer is spending their income in the best way possible to achieve the highest level of satisfaction given the prices of goods and their budget constraints. It's a fundamental concept used to understand how consumers make choices in the market.
Giffen goods -
A Giffen good is a rare and somewhat counterintuitive concept in economics. It's a type of inferior good for which the demand increases as the price rises, and it is named after the Scottish economist Sir Robert Giffen. Giffen goods contradict the law of demand, which generally states that as the price of a good rises, the quantity demanded falls, and vice versa.
The key characteristics of a Giffen good include:
1. **Income Effect Dominates Substitution Effect:** - In the case of Giffen goods, the income effect (the impact of a price change on the consumer's real income) outweighs the substitution effect (the tendency to switch to alternative goods when prices change). When the price of a Giffen good rises, the decrease in the consumer's real income can lead them to buy more of that good, even though it has become more expensive.
2. **Inferior Good:** - Giffen goods are typically considered inferior goods, meaning they are of lower quality or preference compared to other available goods. In some cases, staple foods like bread or rice have been cited as examples of Giffen goods.
3. **Limited Examples:** - While Giffen goods are a theoretically interesting concept, real-world examples are quite rare. Most goods follow the law of demand, where higher prices lead to decreased demand. Giffen goods are more of a theoretical curiosity and have limited practical significance.
The concept of Giffen goods challenges conventional economic wisdom and has led to debates among economists. It's important to note that Giffen goods are a special case and do not represent the typical behavior of most goods and services in the market.
Example of giffen goods -
Giffen goods are rare and often controversial examples in economics, and finding real-world instances can be challenging. Some historical examples have been suggested, but they are still subject to debate. One such historical example is:
**Potatoes during the Irish Potato Famine:** It has been suggested that during the Irish Potato Famine in the 19th century, potatoes, which were a staple food for many Irish peasants, might have exhibited Giffen-like behavior. As the price of potatoes increased due to the crop failure, it is theorized that some people may have increased their consumption of potatoes, even as the price rose, because other food alternatives were even more expensive or scarce. However, the actual existence of Giffen behavior in this case is debated among economists.
It's important to note that Giffen goods are considered exceptional cases and are not representative of typical market behavior. Most goods adhere to the law of demand, where an increase in price leads to a decrease in demand, and vice versa.
Elasticity of demand ( concept and formula )
The elasticity of demand is a fundamental concept in economics that measures the responsiveness of the quantity demanded of a good or service to changes in its price. It quantifies how sensitive consumers are to price changes and provides insights into consumer behavior and market dynamics.
Here are some key points to understand about elasticity of demand:
1. **Elastic vs. Inelastic:** The elasticity of demand can be classified into different categories:
- **Elastic Demand:** When the absolute value of the price elasticity of demand is greater than 1, it indicates that demand is responsive to price changes. In this case, a small change in price leads to a relatively larger change in quantity demanded.
- **Inelastic Demand:** When the absolute value of the price elasticity of demand is less than 1, it indicates that demand is not very responsive to price changes. In this case, a change in price results in a proportionally smaller change in quantity demanded.
- **Unitary Elasticity:** When the price elasticity of demand is exactly equal to 1, it means that the percentage change in quantity demanded is exactly the same as the percentage change in price.
2. **Factors Affecting Elasticity:** Several factors influence the elasticity of demand, including the availability of substitutes, necessity vs. luxury goods, the time horizon, and the proportion of income spent on the good.
3. **Practical Use:** Understanding price elasticity of demand is crucial for businesses and policymakers. Businesses can use it to set pricing strategies, while policymakers can use it to design taxation policies or assess the impact of price controls.
4. **Elasticity and Revenue:** There is an important relationship between elasticity and total revenue. For elastic goods, a decrease in price can lead to an increase in revenue, while for inelastic goods, a decrease in price may result in a decrease in revenue.
Overall, the concept of elasticity of demand is a valuable tool for analyzing and predicting how changes in price affect consumer behavior and the overall dynamics of markets.
Formula to calculate elasticity of demand-
For example -
Q- The price of a commodity decreases from Rs.6 to Rs. 4. This results in an increase in the quantity demanded from 10 units to 15 units. Find the coefficient of price elasticity.
And - q is quantity, p is price and Δ is the change.
Therefore, we have
Δq=15–10=5
Δp=6–4=2
Hence,
=Ep=52×610=1.5
Costumers surplus -
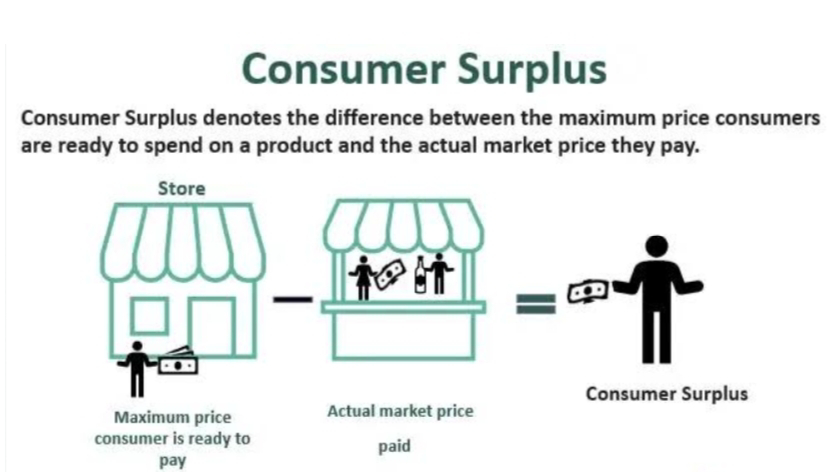
Consumer surplus is an important concept in economics that represents the difference between what consumers are willing to pay for a good or service and what they actually have to pay. It measures the net benefit or gain that consumers receive when they can purchase a product at a price lower than what they were willing to pay.
Here are the key points to understand about consumer surplus:
1. **Willingness to Pay:** Consumer surplus is based on the concept of willingness to pay. It represents the maximum price that consumers are willing and able to pay for a product. This varies from one consumer to another and is often depicted on a demand curve.
2. **Market Price:** The actual price consumers pay for a product is typically determined by the market equilibrium, where supply and demand intersect. This market price may be lower than what some consumers were willing to pay.
3. **Calculation:** Consumer surplus is calculated as the area between the demand curve and the price consumers actually pay for a given quantity of a product. It can be represented graphically as the triangular area between the demand curve and the price level.
4. **Consumer Benefit:** Consumer surplus measures the benefit or gain consumers experience when they can purchase a product for less than their maximum willingness to pay. It represents the extra value consumers receive due to lower prices.
5. **Changes in Price:** Consumer surplus can change as prices fluctuate. An increase in price typically reduces consumer surplus, while a decrease in price often increases it.
Consumer surplus is a valuable concept for understanding consumer welfare and analyzing the effects of price changes, taxes, and government policies on consumer benefits in a market economy.
Note - if you want to know more about it , you can give a valuable comment .
Done by Rohit Joshi...
Recommend....


Comments
Post a Comment