Types of errors , precision and accuracy , uncertainty , significant figures in arithmetics , ( Analytical chemistry ) for B.A. , B.Com. , B.Sc. ) unit 1
Analytical approaches -


Types of errors -
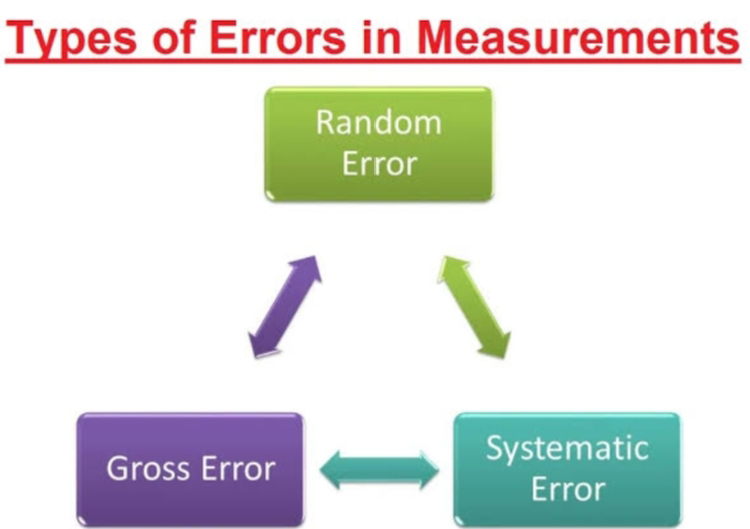
In analytical chemistry, errors can be categorized into three main types:
1. Systematic Errors : These are consistent and reproducible errors that affect the accuracy of measurements. They can be caused by instrumental limitations, calibration issues, or environmental factors. Systematic errors can often be corrected or minimized through proper calibration and measurement techniques.
Types of systematic error -
Systematic errors in analytical chemistry can manifest in several ways, including:
1. Instrumental Errors : These errors are related to the limitations and imperfections of the analytical instruments used. Examples include zero errors in balances, non-linearity in detectors, and drift in electronic components. Calibration and maintenance can help mitigate these errors.
2. Methodological Errors : These errors are associated with the methodology or procedure used in the analysis. They can occur due to improper sample preparation, incorrect reagent concentrations, or inefficient extraction techniques. A thorough and validated method is essential to reduce methodological errors.
3. Matrix Effects: Matrix effects arise when the sample matrix (e.g., the background composition of a sample) interferes with the accuracy of the measurement. These effects can lead to systematic errors in techniques like atomic absorption spectroscopy or mass spectrometry. Sample preparation and the use of internal standards can help address matrix effects.
4. Interference : Interferences occur when substances other than the analyte of interest affect the measurement. For instance, in atomic absorption spectroscopy, spectral interferences from other elements can lead to systematic errors. Methods like background correction or the use of specific wavelengths can reduce interference.
5. Calibration Errors: Errors in the calibration process can introduce systematic errors. If the calibration curve is not linear, or if standard solutions are not properly prepared and stored, it can affect the accuracy of measurements.
6. Sample Contamination: Contamination of samples during handling, storage, or transportation can introduce systematic errors. Proper sample handling protocols, including the use of clean glassware and storage containers, are important to minimize contamination.
Addressing systematic errors typically involves rigorous calibration, method validation, careful sample preparation, and instrument maintenance to reduce their impact on analytical results.
2. Random Errors : Also known as stochastic errors, these are unpredictable fluctuations in measurements that occur due to various factors such as variations in the measurement process, environmental conditions, or instrument precision. Random errors can be reduced by taking multiple measurements and calculating statistical averages.
Types of random error -
Random errors in analytical chemistry are unpredictable fluctuations in measurements that can occur for various reasons. Some common types of random errors in analytical chemistry include:
1. Instrumental Noise : Small fluctuations in instrument readings due to electronic noise, temperature variations, or electronic interference can introduce random errors.
2. Environmental Variability : Changes in environmental conditions, such as temperature, humidity, or air pressure, can affect measurements and result in random errors.
3. Operator Variability : Differences in how different operators perform measurements, such as variations in the rate of sample introduction or observation, can lead to random errors.
4. Sample Heterogeneity : Variability in the composition of a sample, such as uneven distribution of analytes, can cause random errors in the measurement process.
5. Sampling Errors : Errors introduced during the process of collecting a representative sample from a larger population, which can lead to variations in the measured data.
6. Fluctuations in Reagent Quality : Variability in the quality or concentration of reagents or standards used in the analysis can result in random errors.
7. Reading and Recording Errors : Human errors during the reading and recording of measurements, such as misreading a scale or recording the wrong value, can introduce random errors.
To minimize the impact of random errors in analytical chemistry, it is common practice to take multiple measurements and calculate statistical parameters, such as means and standard deviations. This helps to estimate the true value and the precision of the measurements while accounting for random fluctuations. Additionally, proper calibration, instrument maintenance, and quality control procedures are essential for reducing the influence of random errors in analytical data.
3. Gross Errors : These are significant and often avoidable mistakes that can lead to major inaccuracies in analytical results. Gross errors can result from operator mistakes, sample contamination, equipment malfunctions, or procedural errors. Thorough quality control measures are essential to detect and prevent gross errors.
Types of gross error -
Gross errors in analytical chemistry are significant and often avoidable mistakes that can lead to major inaccuracies in analytical results. Some common types of gross errors in analytical chemistry include:
1. Sample Contamination : Introduction of impurities or contaminants into the sample, which can significantly affect the results. This may occur due to improper handling, storage, or transfer of samples.
2. Operator Errors : Mistakes made by the analyst during the analysis, such as incorrectly setting up equipment, using the wrong reagents, or incorrectly following the analytical procedure.
3. Calibration Errors : Failure to calibrate instruments correctly or accurately can lead to gross errors. Using incorrect calibration standards or not properly verifying the calibration can result in significant deviations from accurate measurements.
4. Instrument Malfunctions : Technical issues with the analytical instruments, such as power fluctuations, detector malfunctions, or misalignment of components, can result in gross errors.
5. Procedural Errors : Deviations from the standard operating procedure (SOP) or protocol can introduce gross errors. This may include using incorrect sample volumes, reaction times, or temperature conditions.
6. Data Entry Mistakes : Errors made during data entry and recording, such as transposing numbers or mislabeling samples, can lead to significant discrepancies.
7. Sample Mix-Up : Confusion or mix-up of samples, especially in a busy laboratory setting, can result in gross errors when analyzing the wrong sample.
To minimize gross errors in analytical chemistry, rigorous quality control measures, adherence to established protocols, proper training of laboratory personnel, and careful record-keeping are essential. Identifying and addressing gross errors is critical to maintaining the accuracy and reliability of analytical data.
Precision and accuracy -
In analytical chemistry, precision and accuracy are two critical aspects that describe the quality of measurements:
1. **Precision**:
- Precision refers to the degree of repeatability or reproducibility of measurements. It assesses how close repeated measurements of the same sample are to each other.
- Precise measurements have low variability, meaning that the data points are clustered closely around the average or central value.
- Precision is typically expressed in terms of standard deviation or relative standard deviation (RSD), and it is associated with random errors.
2. **Accuracy**:
- Accuracy describes how close a measurement is to the true or accepted value of the quantity being measured. It assesses the correctness of measurements.
- Accurate measurements are close to the true value and have minimal systematic errors.
- Accuracy can be determined through calibration and validation procedures to ensure that the measurement process is aligned with a known standard.
In summary, precision relates to the consistency of measurements, while accuracy relates to their correctness. Ideally, analytical measurements should be both precise and accurate, meaning that they are repeatable (low precision) and close to the true value (high accuracy). Achieving both precision and accuracy is a fundamental goal in analytical chemistry to ensure the reliability and validity of analytical results.
Precision and accuracy inter relation -
Precision and accuracy are interrelated concepts in analytical chemistry, and they can be understood in the context of a target:
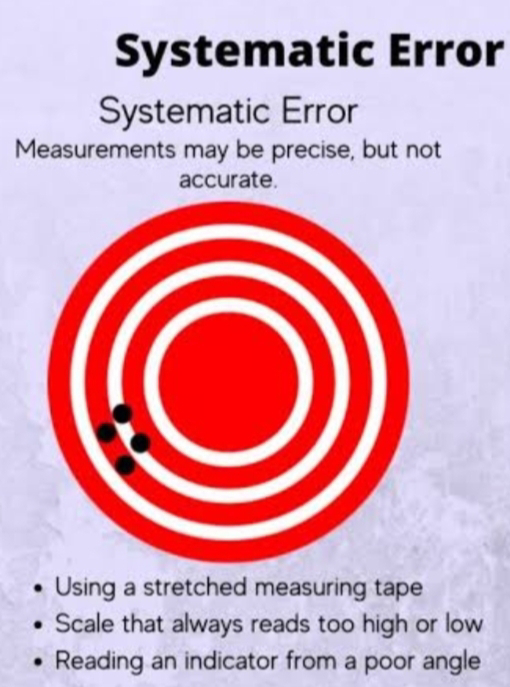
1. **Accuracy** is how close your measurement is to the true or target value. Think of accuracy as hitting the bullseye on a target. An accurate measurement is close to the center of the target, which is the true value.
2. **Precision** is about how consistently you can hit the same spot on the target. If your measurements are precise, they cluster closely together on the target, even if they are not exactly in the center. Precision is about repeatability and consistency.
The interrelation between precision and accuracy can be visualized like this:
High Accuracy, High Precision : This is the ideal scenario. Your measurements are both close to the true value and consistently clustered together. It's like hitting the bullseye repeatedly.
High Accuracy, Low Precision : Your measurements are close to the true value, but they are scattered. Think of this as hitting the target, but not consistently in the same spot.
Low Accuracy, High Precision : Your measurements are consistent and clustered, but they are consistently off from the true value. This is like hitting the same spot on the target, but that spot is not the bullseye.
Low Accuracy, Low Precision : This is the least desirable scenario. Your measurements are neither close to the true value nor consistent. It's like not hitting the target and not hitting the same spot every time.
In practice, achieving both high precision and high accuracy can be challenging, but it's the goal in analytical chemistry. You want your measurements to be not only close to the true value (accurate) but also consistently reproducible (precise). Careful calibration, validation, and quality control procedures are used to improve both accuracy and precision in analytical measurements.
Absolute and relative uncertainty -
In the context of measurements and uncertainty analysis, absolute and relative uncertainty are two ways to express the uncertainty or error associated with a particular measurement:
1. Absolute Uncertainty :
- Absolute uncertainty is a numerical value that represents the actual range within which a measured value is expected to lie.
- It is typically expressed in the same units as the measurement itself (e.g., millimeters, grams, seconds, etc.).
- Absolute uncertainty provides a direct measure of the spread or range of possible values around the measured quantity. It doesn't take into account the magnitude of the measured value.
2. Relative Uncertainty :
- Relative uncertainty, on the other hand, expresses the uncertainty as a fraction or a percentage of the measured value.
- It is calculated by dividing the absolute uncertainty by the measured value and is often expressed as a percentage.
- Relative uncertainty is useful for comparing the significance of uncertainty between measurements of different magnitudes. It provides a way to assess the proportion of the measurement that is uncertain.
Here's how you can calculate relative uncertainty:
Relative Uncertainty (%) = (Absolute Uncertainty / Measured Value) * 100
Both absolute and relative uncertainty are essential in quantifying and reporting the reliability of measurements. Absolute uncertainty provides an understanding of the actual range of possible values, while relative uncertainty helps put the absolute uncertainty in context by expressing it relative to the magnitude of the measured value. Scientists and analysts often use both forms of uncertainty to communicate the quality of their measurements and to make comparisons between different measurements
Significant figures -
Significant figures, also known as significant digits, are important in analytical chemistry as they convey the precision and reliability of a measured or calculated value. The number of significant figures in a value is determined by certain rules, and they are crucial for reporting measurements accurately and maintaining consistency in scientific communication. Here are some key points regarding significant figures in analytical chemistry:
1. Definition : Significant figures are the digits in a number that provide meaningful information about the precision of a measurement or calculation.
2. Rules for Determining Significant Figures :
- All non-zero digits are considered significant. For example, in the number 123.45, all the digits (1, 2, 3, 4, and 5) are significant.
- Leading zeros (zeros to the left of the first non-zero digit) are not considered significant. For example, in 0.0056, only the digits 5 and 6 are significant.
- Trailing zeros (zeros to the right of the last non-zero digit) in a decimal number are significant. For example, in 4.20, all three digits are significant.
- Trailing zeros in a whole number without a decimal point may or may not be significant, depending on how the number is stated. For example, in 500, if it is intended to have three significant figures, then all the zeros are significant. If it is meant to have only one significant figure, then only the last zero is significant (5 x 10^2).
3. Rules for Mathematical Operations :
- When performing mathematical operations (addition, subtraction, multiplication, division) with measured values, the result should be reported with the same number of significant figures as the least precise measurement involved in the calculation.
- In multiplication and division, the result should have the same number of significant figures as the measurement with the fewest significant figures.
- In addition and subtraction, the result should be rounded to the least number of decimal places in the measurements.
4. Significant Figures in Analytical Data : Analytical results should be reported with the appropriate number of significant figures to reflect the precision of the measurement instrument. This ensures that the data's accuracy and reliability are clearly communicated.
Using the correct number of significant figures is important in analytical chemistry to prevent misinterpretation of data and to maintain the credibility and reproducibility of scientific experiments and analyses.
Significant figures in arithmetics -
Significant figures (significant digits) play a crucial role in arithmetic operations, including addition, subtraction, multiplication, and division. When performing these operations, it's essential to follow specific rules for determining the number of significant figures in the result to maintain the accuracy and precision of the calculated value:
1. **Addition and Subtraction**:
- When adding or subtracting numbers, the result should be rounded to the least number of decimal places in the original numbers. This ensures that the result is consistent with the least precise measurement.
- Count the number of decimal places in each number and round the result to the same number of decimal places.
Example:
- 5.321 + 2.4 = 7.721
- The least number of decimal places in the original numbers is one, so the result should be rounded to one decimal place: 7.7
2. **Multiplication and Division**
- When multiplying or dividing numbers, the result should have the same number of significant figures as the original number with the fewest significant figures. This ensures that the result does not imply greater precision than the least precise measurement.
- Count the number of significant figures in each number and round the result to match the fewest significant figures.
Example:
- 3.14 * 2.0 = 6.28
- The number 2.0 has the fewest significant figures (two), so the result should also have two significant figures.
Remember that these rules for significant figures help maintain consistency in reporting the precision of your calculated results and prevent misleading implications of greater precision.
Mean and standard deviation -
In analytical chemistry, the mean and standard deviation are used to summarize and evaluate experimental data, ensuring the accuracy and reliability of measurements. These statistical measures help assess the central tendency and spread of data in analytical experiments:
1. Mean (Average) :
- In analytical chemistry, the mean (average) is calculated to find the central value of a set of data points, such as analytical measurements.
- It represents the typical value and is used to estimate the true concentration or quantity of an analyte.
- The mean is particularly important when analyzing replicate measurements of the same sample.
- It is calculated by summing all data points and dividing by the number of data points.
2. Standard Deviation :
- The standard deviation is a measure of the spread or variation in analytical data.
- In analytical chemistry, it is commonly used to assess the precision and repeatability of measurements. A smaller standard deviation indicates higher precision.
- The standard deviation quantifies the degree to which individual measurements deviate from the mean.
- It helps assess the reliability of a measurement method, as a high standard deviation can indicate the need for improved precision.
- Calculating and reporting the standard deviation is crucial for quality control in analytical chemistry.
Both the mean and standard deviation are essential for analytical chemists to evaluate the reliability and quality of analytical data, ensure that measurements are consistent, and detect any outliers or sources of error in the analytical process. These statistical measures play a vital role in method validation, quality assurance, and decision-making in analytical chemistry.
Done by Rohit Joshi.....
Also read these .


Comments
Post a Comment